15 Cities Where Residents Are Investing in Home Improvements
Editor’s Note: This story originally appeared on Construction Coverage.
During the early days of the COVID-19 pandemic, homeowners across the country used their spare time to tackle overdue home projects. As the year continued, a combination of factors, including low interest rates and rising home prices, helped fuel a boom in home renovations, improvements, and remodels. According to the most recent loan-level data from the Home Mortgage Disclosure Act, there are over half a million home improvement loans approved annually. Home improvement spending grew in 2020 and is expected to continue to climb in 2021.
Home improvement spending has increased steadily since 2010, after falling by 17% during the Great Recession of 2007-09. Typically, home improvement spending falls during economic downturns; however, the COVID-19 recession has proven to be an exception to the rule. One key reason is that the current recession disproportionately impacted lower-wage workers who are less likely to own homes. On the other hand, higher-income homeowners didn’t suffer the same level of job losses or reduced wages, but benefited from reduced spending on things like eating out and travel, which freed up cash for other expenses. With many of such homeowners spending more time at home, they have been eager to create home offices, gyms, and backyard oases featuring decks, outdoor kitchens, and pools.
Investing in home improvements varies by location due to factors such as cost of living, local economic conditions, and the housing market. At the state level, homeowners in Utah and Washington — two of the fastest-growing states — took out the most home improvement loans per capita, at 15.4 and 11.6 loans per 1,000 homeowners, respectively. At the other end of the spectrum, homeowners in Alaska — one of the slowest-growing states — took out the fewest home improvement loans, at just 2.3 loans per 1,000 homeowners.
Large Metros Investing the Most in Home Improvements

To find the metropolitan areas where residents are investing the most in home improvements, researchers at Construction Coverage analyzed the latest data from the Federal Financial Institutions Examination Council’s Home Mortgage Disclosure Act, the U.S. Census Bureau, and Zillow. The researchers ranked metros according to the number of home improvement loans per 1,000 owner-occupied households. Researchers also calculated the total number of annual home improvement loans, the median loan amount, the median home price, and the loan approval rate.
The following are the large U.S. metros (populations of 1 million or more) investing the most in home improvements.
15. Cleveland-Elyria, OH
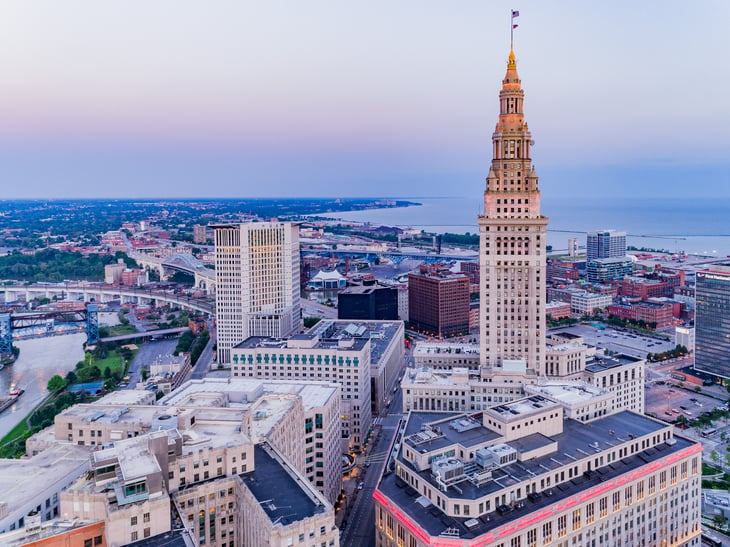
- Home improvement loans per 1,000 owner-occupied households: 9.7
- Total annual home improvement loans: 5,456
- Median loan amount: $55,000
- Median home price: $180,849
- Home improvement loan approval rate: 59.8%
14. Phoenix-Mesa-Chandler, AZ

- Home improvement loans per 1,000 owner-occupied households: 9.7
- Total annual home improvement loans: 11,049
- Median loan amount: $55,000
- Median home price: $351,461
- Home improvement loan approval rate: 52.7%
13. Indianapolis-Carmel-Anderson, IN

- Home improvement loans per 1,000 owner-occupied households: 9.9
- Total annual home improvement loans: 5,099
- Median loan amount: $55,000
- Median home price: $209,258
- Home improvement loan approval rate: 63.0%
12. Philadelphia-Camden-Wilmington, PA-NJ-DE-MD

- Home improvement loans per 1,000 owner-occupied households: 10.1
- Total annual home improvement loans: 15,720
- Median loan amount: $55,000
- Median home price: $284,287
- Home improvement loan approval rate: 55.1%
11. Providence-Warwick, RI-MA

- Home improvement loans per 1,000 owner-occupied households: 10.5
- Total annual home improvement loans: 4,108
- Median loan amount: $55,000
- Median home price: $371,083
- Home improvement loan approval rate: 57.2%
10. Raleigh-Cary, NC

- Home improvement loans per 1,000 owner-occupied households: 10.8
- Total annual home improvement loans: 3,683
- Median loan amount: $55,000
- Median home price: $319,884
- Home improvement loan approval rate: 64.6%
9. Columbus, OH

- Home improvement loans per 1,000 owner-occupied households: 11.2
- Total annual home improvement loans: 5,600
- Median loan amount: $55,000
- Median home price: $240,524
- Home improvement loan approval rate: 65.8%
8. Boston-Cambridge-Newton, MA-NH

- Home improvement loans per 1,000 owner-occupied households: 11.5
- Total annual home improvement loans: 13,085
- Median loan amount: $105,000
- Median home price: $554,870
- Home improvement loan approval rate: 60.5%
7. Pittsburgh, PA

- Home improvement loans per 1,000 owner-occupied households: 12.3
- Total annual home improvement loans: 8,615
- Median loan amount: $55,000
- Median home price: $182,385
- Home improvement loan approval rate: 67.6%
6. Milwaukee-Waukesha, WI

- Home improvement loans per 1,000 owner-occupied households: 12.6
- Total annual home improvement loans: 4,776
- Median loan amount: $55,000
- Median home price: $228,687
- Home improvement loan approval rate: 72.0%
5. Seattle-Tacoma-Bellevue, WA

- Home improvement loans per 1,000 owner-occupied households: 12.6
- Total annual home improvement loans: 11,624
- Median loan amount: $95,000
- Median home price: $615,755
- Home improvement loan approval rate: 65.5%
4. Denver-Aurora-Lakewood, CO

- Home improvement loans per 1,000 owner-occupied households: 13.4
- Total annual home improvement loans: 9,917
- Median loan amount: $75,000
- Median home price: $506,159
- Home improvement loan approval rate: 68.0%
3. Grand Rapids-Kentwood, MI
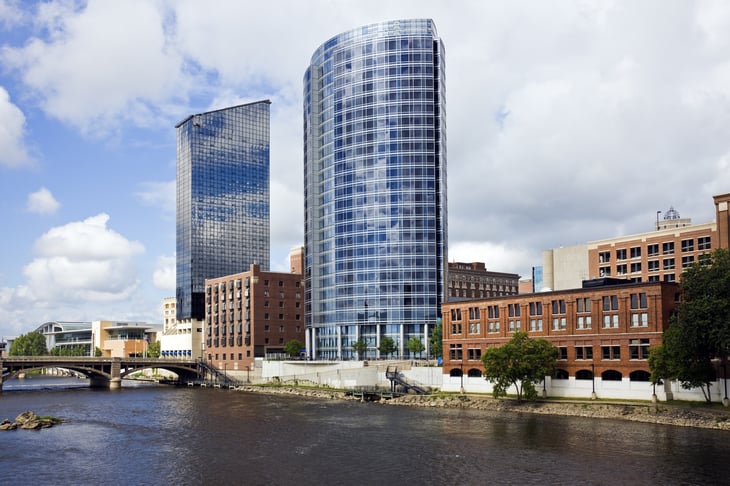
- Home improvement loans per 1,000 owner-occupied households: 13.5
- Total annual home improvement loans: 3,887
- Median loan amount: $35,000
- Median home price: $254,192
- Home improvement loan approval rate: 74.7%
2. Portland-Vancouver-Hillsboro, OR-WA

- Home improvement loans per 1,000 owner-occupied households: 14.2
- Total annual home improvement loans: 8,476
- Median loan amount: $65,000
- Median home price: $473,852
- Home improvement loan approval rate: 69.3%
1. Salt Lake City, UT

- Home improvement loans per 1,000 owner-occupied households: 16.0
- Total annual home improvement loans: 4,425
- Median loan amount: $55,000
- Median home price: $454,676
- Home improvement loan approval rate: 69.5%
Detailed Findings & Methodology

The large metros investing the most in home improvements had 11.9 home improvement loans per 1,000 owner-occupied households, on average. At 16 home improvement loans per 1,000 homeowners, the Salt Lake City metro area had the most per capita home improvement loans of all large metros, over double the national rate of 7.1. The median home improvement loan amount among large metros varies, from $35,000 in the Grand Rapids, Michigan, metro area to over $100,000 in Boston. Home prices range as well, from a median of $181,000 in the more affordable Cleveland metro area to $616,000 in Seattle.
Some of the small and midsize metros with the most improvement loans have upwards of 17 home improvement loans per 1,000 owner-occupied households annually. Indeed, the Madison, Wisconsin, metro area had 20.4 loans per 1,000 homeowners, the most of all metropolitan areas. As expected, home improvement loan approval rates tend to be high in metros with more per capita home improvement loans. The national home improvement loan approval rate is 56.5%, but in the small and midsize metros investing the most in home improvements, rates are more frequently 70% and up, going as high as 89.7% in the Iowa City, Iowa, metro area.
To find the metropolitan areas investing the most in home improvements, researchers at Construction Coverage analyzed the latest data from the Federal Financial Institutions Examination Council’s Home Mortgage Disclosure Act, the U.S. Census Bureau’s 2019 American Community Survey, and Zillow’s Zillow Home Value Index. The researchers ranked metros according to the number of home improvement loans per 1,000 owner-occupied households. In the event of a tie, the metro with the larger number of total annual home improvement loans was ranked higher. Researchers also calculated the median loan amount, the median home price, and the home improvement loan approval rate.
Only conventional, single-family mortgage applications were considered in the analysis. In the calculation of approval rates, withdrawn and incomplete applications, as well as purchased loans, were excluded.
Disclosure: The information you read here is always objective. However, we sometimes receive compensation when you click links within our stories.
Like Article
